If your business operates across multiple legal entities, subsidiaries, or acquired companies, you have almost certainly run into this problem: each entity has its own chart of accounts, and none of them match. One entity books ‘Marketing Expenses’ under code 6100, another uses 7200, and a third splits it into three separate line items. When it comes time to consolidate financials, someone on your team spends days manually reconciling everything in a spreadsheet — only to do it all again next month.
This is not a niche problem. It affects growing businesses, acquisitions, franchise groups, not-for-profits with multiple programs, and any organisation using more than one accounting system. The good news is that there are structured, repeatable approaches to solving it — and modern data and automation tools make it far more manageable than it used to be.
Why Charts of Accounts Diverge in the First Place
Charts of accounts tend to diverge for very practical reasons. A subsidiary was acquired with its own accounting setup and nobody had time to remap it. Different departments pushed for different reporting structures. One entity runs on Xero, another on MYOB, and a third on a bespoke ERP. A franchisee set up their own ledger without a template. These are all legitimate business circumstances, not signs of poor management.
Stop building consolidations in spreadsheets.
BrizoConsol automates multi-entity consolidation — setup in minutes, reports the same day.
The problem emerges when you need consolidated data. Profit and loss across entities, cost-centre reporting, intercompany eliminations — all of these require that the same economic concepts appear under consistent categories. Without that, your only option is to map them manually every reporting cycle.
The core challenge is not that your entities have different account codes — it is that there is no persistent, machine-readable mapping between those codes and a unified reporting structure. Once you create and maintain that mapping, consolidation becomes a process rather than a project.
Step One: Audit What You Actually Have
Before you can map anything, you need a clear inventory of each entity’s chart of accounts. This sounds obvious, but many businesses discover during this audit that their entities have hundreds of rarely used accounts, duplicated codes, or accounts that were created for a single transaction years ago and never closed.
Export the full account list from each system — code, name, type (asset, liability, equity, revenue, expense), and where possible, whether the account had any transactions in the last twelve months. You are looking for active accounts, account types, and the naming conventions each entity uses. Group them by type first: revenue, cost of goods, operating expenses, and balance sheet items (assets, liabilities, and equity). This gives you a working surface before you start making mapping decisions.
Step Two: Design a Canonical Chart of Accounts
A canonical chart of accounts — sometimes called a group or reporting COA — is the unified structure that all entity accounts will map to. It does not replace each entity’s local COA. Each entity continues operating with whatever codes and names it uses in its own accounting system. The canonical COA exists purely for consolidation and reporting.
When designing this structure, resist the temptation to mirror the most detailed entity. If one entity has 40 expense accounts and another has 8, your canonical COA should reflect the level of granularity that is actually useful for decision-making — not the maximum level that exists anywhere. You can always create sub-categories later as needed.
A practical starting point is a standard structure aligned with your statutory reporting requirements — typically following the format of your profit and loss and balance sheet. From there, add segments that matter to your business: by region, by product line, by cost centre. Keep the canonical COA as lean as possible while still answering your core reporting questions.
| Canonical Account | Entity A Code | Entity B Code | Entity C Code | Account Type |
|---|---|---|---|---|
| Product Revenue | 4000 | REV-100 | Income_Sales | Revenue |
| Service Revenue | 4100 | REV-200 | Income_Services | Revenue |
| Cost of Goods Sold | 5000 | COGS-100 | Direct_Costs | Expense |
| Payroll Expenses | 6100 | PAY-001 | Wages_Salaries | Expense |
| Marketing Expenses | 6200 | MKT-100 | Mktg_Spend | Expense |
| Depreciation | 7100 | DEP-001 | Depreciation_Expense | Expense |
| Accounts Receivable | 1200 | AR-001 | Debtors | Asset |
| Accounts Payable | 2100 | AP-001 | Creditors | Liability |
Step Three: Build the Mapping Layer
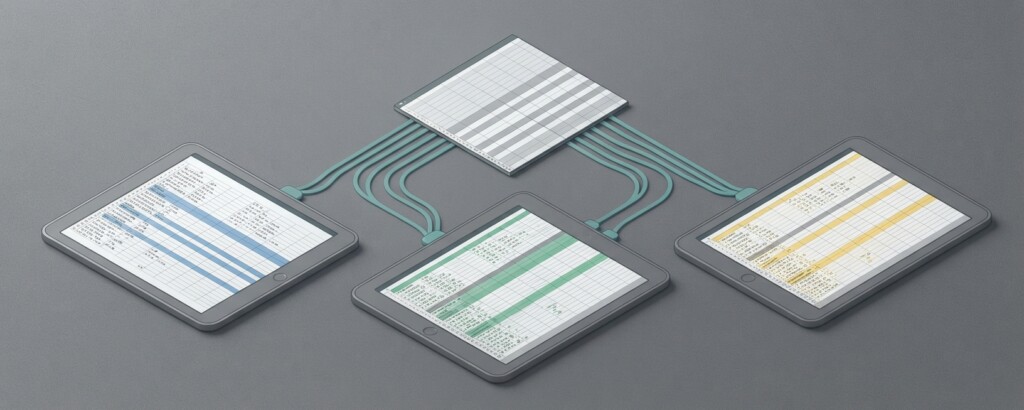
The mapping layer is the connective tissue between each entity’s local accounts and your canonical COA. In its simplest form, it is a table: entity, local account code, local account name, canonical account. Every account in every entity maps to exactly one canonical account. Some canonical accounts will have many local accounts mapping to them; others might have only one.
There are several tools and approaches available depending on your technical setup. A well-maintained spreadsheet can work for two or three entities with stable account structures. A dedicated consolidation platform or financial data integration tool is a better option for four or more entities, frequent changes, or where you need to automate the process. The key is that the mapping lives in a single place, is version-controlled, and is applied consistently.
One practical approach is to store your mapping in a structured data file — a spreadsheet or a database table — and use it as a lookup that transforms extracted trial balance data before loading it into your consolidation model. If your integration tool supports transformation rules, you can define these mappings once and have them applied automatically on every data pull.
Watch out for one-to-many splits in the wrong direction. Some accounts in one entity might need to map to multiple canonical accounts — for example, a single ‘Utilities and Communications’ account that should split between two canonical lines. If your mapping tool does not support percentage-based or rule-based splits, you may need to adjust either the local COA or accept a less granular canonical category. Do not create artificial precision you cannot reliably source from the underlying data.
Step Four: Automate the Extraction and Transformation
Manual mapping is only half the battle. Even with a perfect mapping table, if someone still has to manually export trial balances, apply the mapping in a spreadsheet, and paste results into a consolidation model, you have not eliminated the rework — you have just made it slightly more structured.
The goal is to automate the extract-transform-load (ETL) process. Your accounting systems output trial balance data on a defined schedule. Your mapping rules transform the local accounts to canonical accounts. The result loads into your consolidation or reporting layer without manual intervention. When an entity’s account structure changes, you update the mapping table — not the entire process.

Tools that support this kind of pipeline include dedicated financial consolidation platforms, business intelligence tools with built-in transformation capability, and general-purpose data integration platforms. The right choice depends on your data volumes, the complexity of your entity structure, and how much technical capacity you have internally. What matters most is that the mapping is applied programmatically, not manually.
Handling Common Edge Cases
Real-world COA mapping always surfaces edge cases. Here are the most common ones and how to handle them practically.
- Accounts with no obvious canonical equivalent: Create a temporary ‘Unclassified’ or ‘Review Required’ canonical category. Flag these in your reporting. Do not silently drop transactions or force them into a wrong category.
- Intercompany accounts: These need special handling. Tag them as intercompany in your mapping so they can be identified and eliminated during consolidation. Do not map them to standard P&L or balance sheet categories without the elimination step.
- Tax and GST accounts: These vary significantly by jurisdiction and entity type. Map them to canonical tax-specific categories rather than lumping them with operating expenses or revenue.
- Accounts that change meaning over time: An account code reused for a different purpose after a system migration will corrupt historical comparisons. Date-stamp your mapping rules where possible, or maintain mapping versions by period.
- Different currencies: COA mapping does not solve currency translation, but make sure your canonical structure clearly separates the mapping step from the translation step. Apply consistent exchange rates at the extraction or loading stage.
Governance: Keeping the Mapping Current
The most common reason COA mapping projects fail is not technical — it is governance. The mapping is built once, then an entity adds new account codes, and nobody updates the mapping table. Three months later, those transactions are sitting in an ‘Unclassified’ bucket or, worse, silently mapped to the wrong canonical account because an old rule matched on a partial name.
Establish a simple process: any new account code added to any entity’s COA must be mapped before it goes live. This means your finance team needs visibility into COA changes across entities — ideally through a regular review or an automated alert when unmapped transactions appear in reporting. Treat the mapping table as a controlled document with a named owner and a change log.
A useful test: run your consolidation process at the end of each period and check the balance of your ‘Unclassified’ or ‘Unmapped’ canonical category. If it is zero, your mapping is current. If it is not, you have new accounts that need to be addressed before the numbers are reliable.
What Good Looks Like: A Practical Benchmark
A well-implemented COA mapping process should mean that your monthly consolidation runs with minimal manual intervention. Your finance team reviews the output rather than building it. Changes to entity account structures are handled in the mapping layer, not by editing reports. New entities can be onboarded by exporting their COA and mapping it — not by restructuring your entire reporting model.
The time saving varies by organisation, but teams that move from fully manual consolidation to a mapped and automated process typically reduce consolidation time by 60 to 80 percent on a recurring basis. The first-time setup takes effort — especially the audit and canonical design steps — but that investment pays back quickly once the process runs reliably.
If you are managing four or more entities, operating across different accounting platforms, or dealing with regular acquisitions that bring new account structures, this is not a nice-to-have. Unreliable consolidation means unreliable decisions. Getting the mapping layer right is foundational to everything else your financial reporting depends on.
Managing financial data across multiple entities?
If your team is spending too much time on manual reconciliation and COA mapping, there are better ways to structure the process. Explore how we help businesses build reliable, automated financial data workflows.