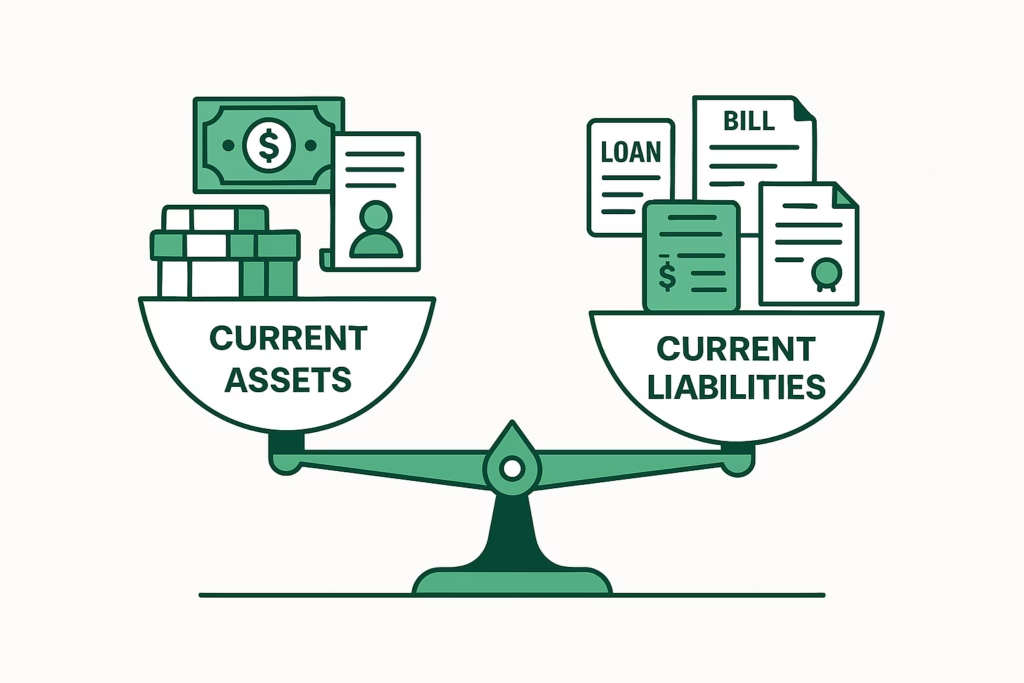
The current ratio measures whether a company can cover its short-term obligations using its short-term assets. It is one of the most widely used liquidity metrics because it is simple to calculate, universally understood, and available from the balance sheet alone. Lenders include minimum current ratio thresholds in loan covenants, credit analysts use it to assess refinancing risk, and finance teams monitor it as an early warning on working capital.
Formula and Calculation
Current Ratio = Current Assets ÷ Current Liabilities
Current assets are resources expected to be converted to cash or consumed within 12 months: cash and bank balances, accounts receivable, inventory, short-term investments, and prepaid expenses.
Stop building consolidations in spreadsheets.
BrizoConsol automates multi-entity consolidation — setup in minutes, reports the same day.
Current liabilities are obligations due within 12 months: accounts payable, accrued expenses, short-term borrowings, the current portion of long-term debt, and deferred revenue (where the performance obligation is expected within 12 months).
Worked example Current assets: Cash $80,000 + Receivables $220,000 + Inventory $300,000 = $600,000
Current liabilities: Payables $180,000 + Accrued expenses $70,000 + Current bank facility $50,000 = $300,000
Current ratio = $600,000 / $300,000 = 2.0
The company has $2.00 of current assets for every $1.00 of current liabilities.
Interpreting the Result
| Current ratio | Interpretation | Typical signal |
|---|---|---|
| Above 2.0 | Strong short-term liquidity buffer | Positive — but very high ratios may indicate excess inventory or idle cash not efficiently deployed |
| 1.5 – 2.0 | Healthy liquidity in most sectors | Generally comfortable — the business can absorb moderate unexpected outflows |
| 1.0 – 1.5 | Adequate but tight | Requires monitoring — a slowdown in receivables or inventory build-up could create pressure |
| Below 1.0 | Current liabilities exceed current assets | Potential liquidity risk — may need to refinance short-term obligations or inject equity |
No single threshold applies universally. Industry context matters significantly. Supermarket chains routinely operate with current ratios below 1.0 because their customers pay immediately (no significant receivables) while their suppliers provide credit terms (payables are a source of working capital). A manufacturing company or distributor carrying substantial inventory and providing trade credit to customers typically needs a higher ratio to manage the cash conversion cycle.
The Three Liquidity Ratios — Which One to Use
The current ratio is the broadest of three standard liquidity measures. The choice between them depends on how conservatively you want to treat the current asset base.
Current Ratio = Current Assets / Current Liabilities
Includes all current assets. Least conservative.
Quick Ratio (Acid Test) = (Current Assets − Inventory − Prepayments) / Current Liabilities
Excludes inventory and prepayments. More conservative.
Cash Ratio = (Cash + Short-term Investments) / Current Liabilities
Only the most liquid assets. Most conservative.
The quick ratio is usually a more useful measure than the current ratio where inventory is a significant component and its liquidation value is uncertain. A business with $300,000 of inventory in the worked example above has a quick ratio of ($600,000 − $300,000) / $300,000 = 1.0 — adequate, but substantially tighter than the 2.0 current ratio suggests. The difference tells you that the liquidity buffer exists largely in inventory, not in readily liquid assets.
What the Current Ratio Doesn’t Tell You
The current ratio has well-known limitations that matter in practice:
- Inventory quality: Inventory is included at carrying value. Obsolete, slow-moving, or difficult-to-sell inventory overstates the true liquidity of the current asset base. A current ratio of 2.0 built on three months of undisposed inventory in a declining market is not the same as a current ratio of 2.0 built on cash and near-current receivables.
- Receivables collectability: Accounts receivable are included at their gross amount less any provision for bad debts. If the provision doesn’t fully reflect collection risk — particularly in businesses with customer concentration or extended credit terms — the receivables balance overstates liquid assets.
- Timing within the period: The current ratio is a point-in-time snapshot. A business with strong seasonal cash flows may show an excellent current ratio at year-end (post-peak season) and a poor one six months later. The ratio at the balance sheet date may not represent the business’s typical liquidity position.
- Committed vs available facilities: The current ratio doesn’t reflect undrawn credit facilities that can be drawn immediately. A business with a current ratio of 0.9 but a fully committed and undrawn $500,000 revolving credit facility has more liquidity than its balance sheet suggests.
The Current Ratio in a Group Context
In a multi-entity group, the consolidated current ratio and the individual entity current ratios can tell very different stories. The consolidated ratio averages across all entities — it can look healthy even when individual entities are under pressure.
Entity vs group — why the consolidated ratio can mislead Parent Co: current assets $1,200,000 / current liabilities $500,000 → current ratio: 2.4
Subsidiary A: current assets $300,000 / current liabilities $400,000 → current ratio: 0.75
Consolidated (after eliminating $150,000 of intercompany receivable/payable):
Current assets: $1,200,000 + $300,000 − $150,000 = $1,350,000
Current liabilities: $500,000 + $400,000 − $150,000 = $750,000
Consolidated current ratio: $1,350,000 / $750,000 = 1.8
The group current ratio of 1.8 looks healthy. Subsidiary A’s current ratio of 0.75 signals genuine short-term liquidity stress that the group number masks.
💡 For groups with external debt at the entity level: If Subsidiary A has its own bank facility with a minimum current ratio covenant (say, 1.1), the consolidated group ratio of 1.8 is irrelevant to that covenant. The subsidiary’s standalone ratio of 0.75 is what matters — and it’s already below the threshold. Entity-level liquidity must be monitored alongside consolidated liquidity.
The intercompany elimination also changes the ratio directly. When intercompany receivables (current assets) and intercompany payables (current liabilities) are eliminated on consolidation, equal amounts are removed from both sides. For entities that carry significant intercompany balances relative to their third-party current assets and liabilities, the entity-level current ratio can be very different from what its contribution looks like after consolidation.
For groups monitoring liquidity at both entity and consolidated level, BrizoConsol provides entity-level and group-level balance sheet reporting from the same consolidated data — making it straightforward to track the current ratio at every level of the group structure. Learn more or see it in action →