As group structures grow, consolidated numbers alone are often not enough. Finance teams need to understand where the numbers come from, not just what the final total is.
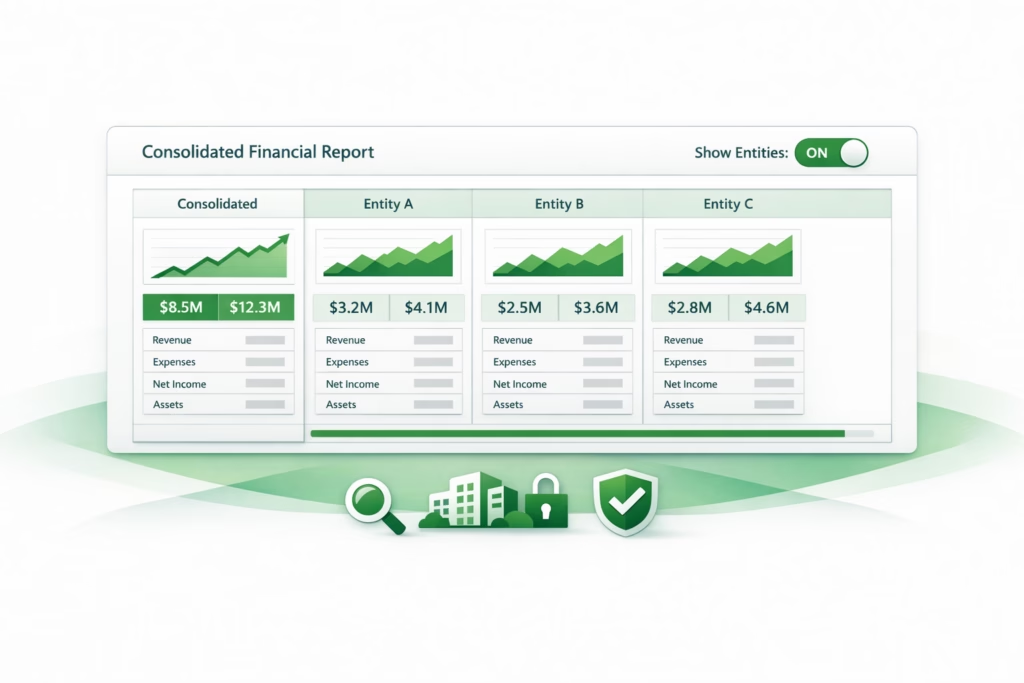
BrizoConsol’s Entities in Reports feature gives users instant visibility into entity-level contributions without leaving the report — by expanding any consolidated report to show each entity as a column alongside the group total, with a single click.
The Problem With Purely Consolidated Views
A consolidated report shows the group total. What it doesn’t show is which entity drove a movement, which subsidiary is underperforming, or which entity’s numbers look unusual. To answer any of those questions from a purely consolidated report, the finance team has to go back to the source — running separate entity-level reports, exporting to spreadsheet, and manually building the comparison that the group report should have shown in the first place.
This switching between consolidated and entity views is one of the most consistent sources of friction in group reporting. The information is all in the system; the problem is that consolidated reports and entity reports are treated as separate outputs rather than as different views of the same data.
The specific friction — without entity columns The CFO reviews the consolidated P&L and notices group gross margin dropped from 38.2% last month to 35.7% this month. She asks the finance team what drove it.
Without entity columns, the finance team opens a separate report for each subsidiary, copies the gross profit line into a spreadsheet, recalculates margins, and compares — about 25 minutes of work before they can answer the question.
With entity columns enabled in the same report, the answer is visible immediately: AU Manufacturing’s gross margin dropped from 41% to 32% because of a raw material cost spike, while the other entities were flat. The CFO has her answer in the same meeting.
How the Show Entities Feature Works
The Show Entities button appears within any BrizoConsol report. When toggled on, the report automatically extends to display each entity in its own column alongside the consolidated group total. The report structure stays the same — the same accounts, the same periods, the same formatting — but with each entity’s contribution now visible side by side.
Users can switch between the consolidated view and the entity-expanded view at any point. There is no need to rebuild the report, export data, or navigate to a separate screen. The entity columns appear and disappear with the toggle, keeping the report clean when the consolidated view is all that’s needed and adding the entity breakdown when it isn’t.
Three Use Cases Where Entity Columns Change the Analysis
Month-end close validation
During the consolidation review, finance teams need to verify that the group totals are correct before the reports go to the board. With entity columns enabled, the sum of each entity’s column should equal the group total — with the difference accounted for by eliminations. Seeing all entities side by side makes it immediately apparent if one entity’s figures look out of range or if an elimination has been applied incorrectly. A check that previously required cross-referencing multiple reports now happens within the consolidated report itself.
Entity performance comparison for management reporting
Board and management teams often want to see all subsidiaries compared in a single view — which is performing best, which is lagging, and where the group’s margin or cost structure differs across entities. A consolidated report doesn’t show this; a separate entity pack does but requires preparation. Entity columns in the consolidated report provide the comparison directly, without a separate deliverable.
Example — entity revenue comparison in a single view Group revenue: $8,400,000
Entity columns show: SG entity $3,200,000 / AU entity $2,900,000 / UK entity $2,300,000
Eliminations: ($0) — no intercompany revenue in this period
The board can immediately see that the UK entity is the smallest contributor and that the SG entity grew while the UK declined — from the same report, without a separate slide or spreadsheet.
Budget vs actual with entity breakdown
Entity columns are particularly powerful in comparison reports. A budget vs actual report with entity columns shows not just that the group missed revenue by $400,000, but which specific entity drove the miss and how the variance is distributed across the group. This enables the right conversation — not “the group was behind budget” but “the AU entity was $600,000 behind budget while SG was $200,000 ahead.”
Visibility Without Clutter
The Show Entities feature doesn’t change how data is prepared or consolidated. It doesn’t require any additional configuration or report rebuilding. It is a display toggle that makes reporting more transparent and more useful — available when needed, off when the consolidated view is sufficient.
For groups whose finance teams currently spend close week switching between a consolidated report and separate entity exports to answer management questions, this is a direct reduction in that effort — the entity breakdown is already in the consolidated report, one click away.
See how BrizoConsol’s Entities in Reports feature gives finance teams instant entity-level visibility within any consolidated report. Learn more or see it in action →