Budgeting and forecasting are not just planning exercises — they are essential tools for steering the business. Yet for many finance teams, budgets and forecasts live outside the reporting process, tracked in spreadsheets disconnected from actual results. When actuals come in and it’s time to explain the variance, the analysis starts with a reconciliation exercise just to get the two datasets onto the same basis.
BrizoConsol’s Budget & Forecast feature closes this gap — allowing finance teams to input, track, and compare budgets and forecasts directly within the same reporting environment as actuals.
Why the Disconnect Between Planning and Reporting Creates Problems
The typical multi-entity group carries budgets and forecasts in a planning spreadsheet built separately from the consolidation model. The two datasets use different account structures, different entity hierarchies, and often different currency conversion assumptions. When actuals are ready, producing a meaningful budget vs actual report requires first translating the planning data into the reporting structure — which is a manual process that consumes time and introduces error at exactly the point when the finance team is already under close pressure.
The problem compounds at the group level. An entity-level budget vs actual comparison is relatively straightforward. A group-level comparison requires the budget to be consolidated in the same way as the actuals — with the same intercompany eliminations, the same exchange rates applied to foreign currency budgets, and the same group COA structure. A planning spreadsheet that was never built for consolidation cannot do this reliably.
Budget & Forecast Input in BrizoConsol
With BrizoConsol’s Budget & Forecast feature, planning data is input directly into the platform using the same entity structure, account mapping, and period framework as actuals. Budgets and forecasts follow the same group COA — so when a budget vs actual comparison is run, both sides are already on the same basis. No translation, no reconciliation, no manual alignment.
This means the group-level comparison is also consolidated correctly. Budget figures entered at the entity level roll up through the group hierarchy, with the same intercompany logic and currency treatment applied as for actuals. The consolidated budget vs actual view is produced from the same engine that produces the consolidated actuals — with no separate consolidation exercise required for the planning data.
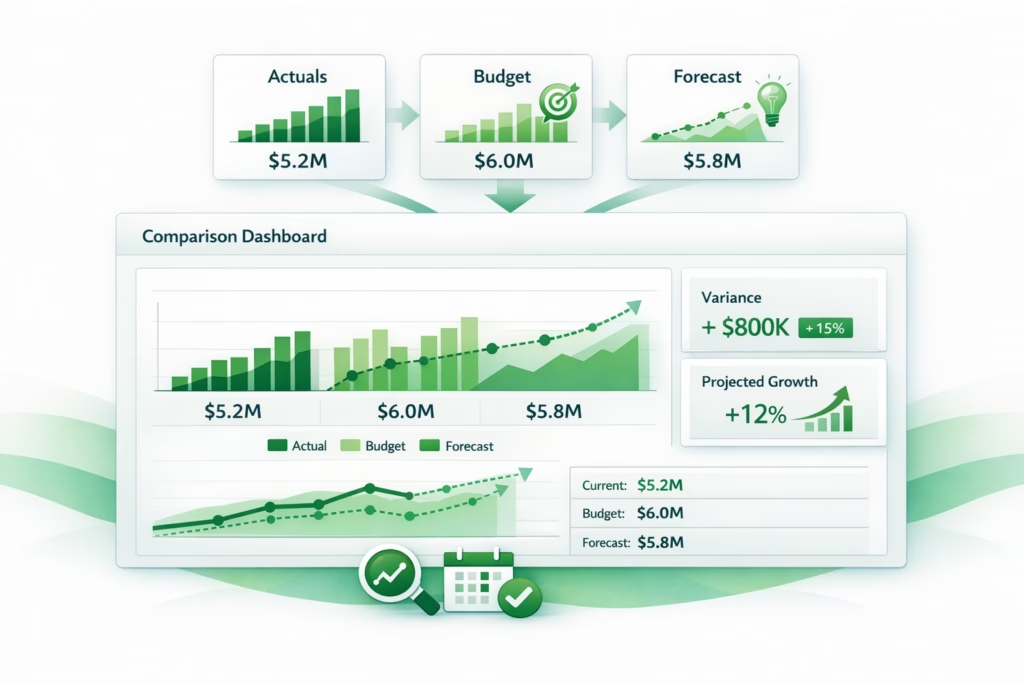
Comparison Reports: Actuals vs Budget vs Forecast
BrizoConsol’s comparison reports allow finance teams to view actuals against budget, actuals against forecast, or budget against forecast — at the entity level, the virtual group level, or the full consolidated group level. Variances are calculated and displayed by period or year to date, making it straightforward to identify where performance is ahead of or behind plan and at what level of the group the variance is concentrated.
This enables faster performance reviews and clearer conversations with management — without requiring a separate offline variance model to be built and reconciled before each board meeting.
Forecast Versions Over Time
A budget set in January rarely reflects the business environment by June. Most finance teams maintain multiple forecast versions through the year — the original budget, a Q1 reforecast, a Q2 reforecast, and a latest estimate. Managing these versions in a spreadsheet creates version control problems: which file is current, which has been shared with investors, which was used in the board pack last month.
BrizoConsol supports maintaining multiple forecast versions within the same platform, with each version clearly labelled and timestamped. Historical forecast versions remain accessible for comparison, so finance teams can track how their forward view has evolved and explain the changes to management or auditors.
Input Helper: Five Projection Methods
Manually entering forecast values period by period for every account across every entity is impractical at scale. BrizoConsol’s input helper provides five structured projection methods that generate forward values based on defined logic — reducing manual entry while improving consistency.
Repeat the value
Result = fixed value
Use for: stable cost lines with no expected movement — fixed rent, contracted service fees, board retainer costs.
Repeat the value with an amount add-on
Result = value + amount
Use for: step increases — a lease where rent increases by $500/month from a certain date, or a salary line increasing by a fixed amount.
Repeat the value with a percentage applied
Result = value × (1 + percentage / 100)
Use for: growth-based assumptions — revenue lines with an assumed growth rate, cost lines with an expected inflation uplift.
3-month moving average
Result = average of last 3 months × (1 + percentage / 100)
Use for: smoothing short-term volatility — accounts with seasonal swings where recent trend is more relevant than any single month.
6-month moving average
Result = average of last 6 months × (1 + percentage / 100)
Use for: stable trend-based forecasting — cost lines where the underlying run rate is consistent and a longer average reduces noise.
💡 Projection methods can be mixed by account: Revenue lines can use a growth percentage, stable cost lines can use repeat value, and volatile lines can use a moving average — all within the same forecast build. The input helper applies whichever method is appropriate for each account, reducing both manual effort and forecast error.
Planning Data That Is Reporting-Ready From Day One
The fundamental advantage of having budgets and forecasts inside the consolidation environment is that the planning data is already in reporting format. There is no export, no reformatting, and no reconciliation required to produce a group budget vs actual comparison. The comparison runs from data that was entered using the same account structure, the same entity hierarchy, and the same currency framework as the actuals it will be compared against.
For finance teams that currently spend significant time each month reconciling planning data to reporting data before they can even begin the variance analysis, this is a structural change to the close process — not an incremental improvement to it.
See how BrizoConsol brings budgets, forecasts, and actuals into a single group reporting environment — with consolidated comparisons available at every level of the group. Learn more or see it in action →