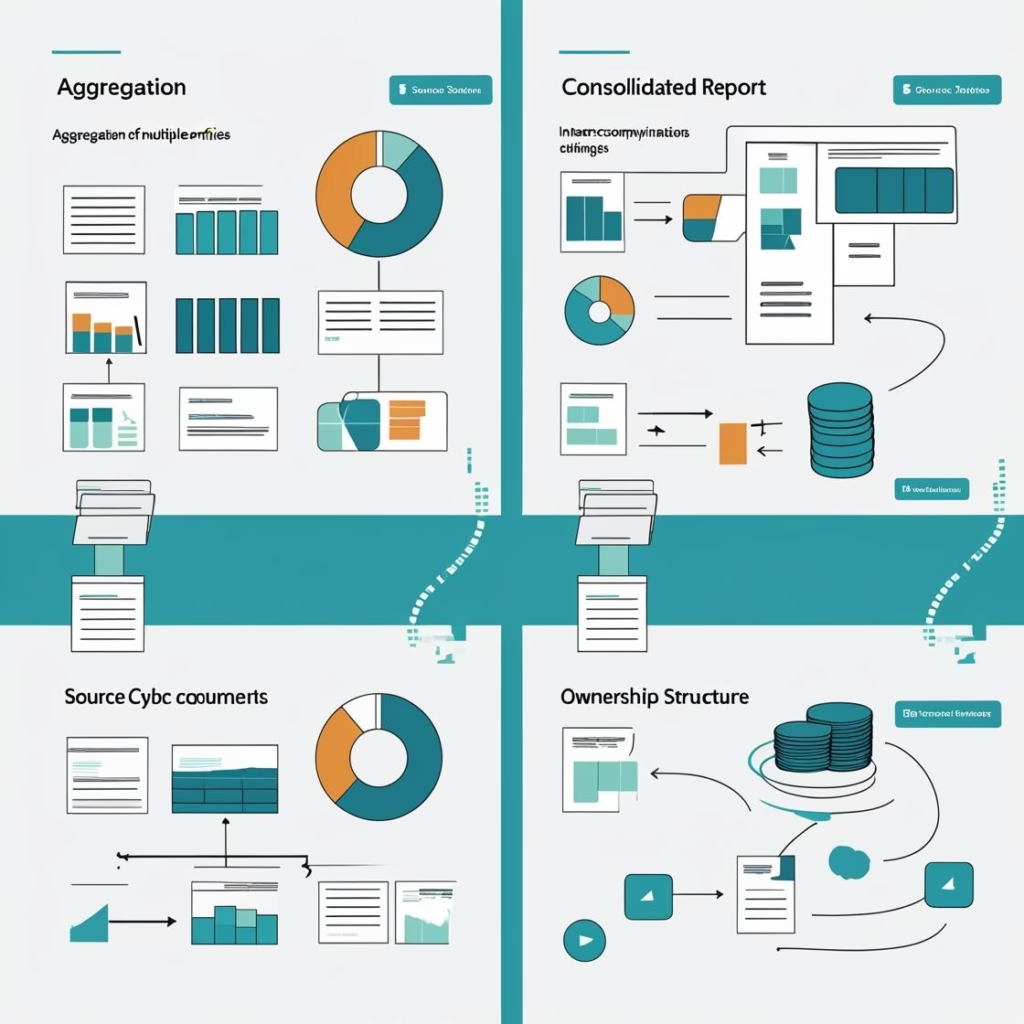
Consolidation and aggregation are not the same thing — and treating them as equivalent is one of the most consequential errors a multi-entity business can make in its financial reporting. Both produce a combined view of multiple entities. Only one of them reflects the group’s actual economic reality.
The difference matters because the numbers that come out of aggregation can be materially wrong in ways that look entirely plausible. A board, investor, or auditor reviewing aggregated results will see figures that overstate revenue, overstate assets, and misrepresent the group’s true performance — not because the underlying entity data is wrong, but because the adjustments that turn multiple entity statements into a group statement have not been applied.
What Aggregation Is
Aggregation means combining data by adding it together. If a group has three entities with individual P&Ls, aggregation adds up all their revenues, costs, assets, and liabilities into a single combined view. No adjustments are made for transactions between entities, no account is taken of ownership structure, and no currency translation is applied at the group level.
Automate NCI calculations across all your entities.
BrizoConsol handles non-controlling interest automatically — no manual adjustments required.
Aggregation is fast and requires no structural adjustments. For that reason, it has legitimate uses — quick internal reviews, management dashboards where the audience understands the limitations, or early-stage planning where a rough combined picture is sufficient. But aggregation makes no attempt to present the group as a single economic entity. What it produces is a sum of parts, not a group statement.
What Consolidation Is
Consolidation is the full process of preparing group financial statements that present the group as if it were a single economic entity. Under IFRS 10 and ASC 810 (US GAAP), this is a mandatory requirement for any parent company that controls one or more subsidiaries. It involves five adjustments that aggregation skips entirely:
- Eliminating intercompany transactions: Sales, loans, dividends, and balances between group entities are removed so only external transactions remain in the group statements.
- Removing unrealised profits: Where goods have been sold between group entities but not yet sold externally, the profit embedded in the intercompany sale price is deferred until it is realised through an external transaction.
- Adjusting for ownership structure: Where a subsidiary is partially owned, the non-controlling interest (NCI) is recognised separately in both equity and the income statement — the minority shareholders’ portion is not attributed to the parent.
- Converting currencies: Where entities operate in different functional currencies, their financials are translated into the group’s presentation currency at the correct rates — closing rate for balance sheet items, average rate for P&L items.
- Aligning accounting policies: Entities using different accounting treatments for the same items must be adjusted to a consistent basis before consolidation — LIFO inventory vs FIFO, for example, or different depreciation methods for equivalent assets.
Each of these adjustments changes the numbers. The extent of the change depends on how much intercompany activity the group has, how many currencies are involved, and how divergent the entity accounting policies are. For some groups, the adjustments are modest. For others, the difference between aggregated and consolidated results is material.
The Difference in Practice — A Worked Example
Group structure and period activityParent Co | Subsidiary A (manufacturing) | Subsidiary B (distribution)
During the period:
• Subsidiary A sells goods to Subsidiary B for $200,000 (cost to Subsidiary A: $140,000 — intercompany profit: $60,000)
• Subsidiary B sells all $200,000 of those goods to external customers for $300,000
• Parent charges Subsidiary A a $50,000 management fee
Scenario 1: All goods sold externally by period end
| Line Item | Aggregated | Consolidated | Difference |
|---|---|---|---|
| External revenue (Sub B) | $300,000 | $300,000 | — |
| Intercompany revenue (Sub A → Sub B) | $200,000 | $0 (eliminated) | −$200,000 |
| Management fee income (Parent) | $50,000 | $0 (eliminated) | −$50,000 |
| Total income | $550,000 | $300,000 | −$250,000 |
| Intercompany receivable (Sub A) | $200,000 | $0 (eliminated) | −$200,000 |
The aggregated view shows $550,000 of income — 83% more than the group actually earns from external customers. The $250,000 difference is entirely internal: revenue earned by one group entity from another, which disappears when the group is viewed as a single unit.
Scenario 2: Only half the goods sold externally by period end
Now suppose Subsidiary B only sells $150,000 of the goods externally by period end, with the remaining $50,000 intercompany cost still sitting in inventory.
The intercompany sale elimination still removes $200,000 from Sub A’s revenue and Sub B’s cost of sales. But the $60,000 intercompany profit is only partially realised: $30,000 relates to the goods sold externally (realised — included in the group result) and $30,000 relates to goods still in inventory (unrealised — must be eliminated from the group result and from Sub B’s inventory value).
| Adjustment | Amount | Where it goes |
|---|---|---|
| Eliminate intercompany sale | −$200,000 revenue / −$200,000 cost | Removes internal transaction; group gross profit unchanged at this step |
| Eliminate unrealised profit in inventory | −$30,000 gross profit / −$30,000 inventory | Defers profit on unsold goods; inventory written down to group cost |
| Eliminate management fee | −$50,000 income / −$50,000 expense | Internal recharge removed from both sides |
The unrealised profit elimination — the step most often missed by groups doing manual consolidations — reduces both group profit and group inventory. When Sub B eventually sells the remaining goods externally in the next period, the deferred profit is recognised at that point. The group’s total profit is correct over both periods combined; without the elimination, it is overstated in period one and understated in period two.
Side-by-Side Comparison
| Feature | Aggregation | Consolidation |
|---|---|---|
| Intercompany transaction elimination | Not done | Required |
| Unrealised profit in inventory | Not done | Required where goods remain unsold |
| Currency translation at group level | Often skipped | Required (closing rate BS, average rate P&L) |
| NCI recognition | Not done | Required for partially-owned subsidiaries |
| Accounting policy alignment | Not done | Required where policies differ |
| IFRS/GAAP compliance | Not guaranteed | Required for parent companies controlling subsidiaries |
| Suitable for | Internal dashboards, quick management views | Audited accounts, investor/lender reporting, board packs |
When Aggregation Is Appropriate
Aggregation isn’t wrong — it’s limited. It has legitimate uses:
- Internal management dashboards where speed matters and the audience understands the figures are pre-elimination
- Preliminary close checks — an aggregated view before eliminations are posted helps identify data gaps or missing entity submissions
- Groups with no intercompany trading — where entities don’t transact with each other and use the same currency, the aggregated and consolidated results may be identical or near-identical
- Early-stage planning where the rough combined picture is all that’s needed before full consolidation infrastructure is in place
The moment intercompany transactions are involved — or results are going to investors, auditors, lenders, or regulators — aggregation is not appropriate as a substitute for consolidation.
Common Misconceptions
“Our group doesn’t really trade internally, so aggregation is fine.” Possibly — but most groups have at least some intercompany activity: management fee charges, shared service costs, intercompany loans. Even a single intercompany loan creates a receivable in one entity and a payable in another that inflate the aggregated balance sheet. Check before assuming.
“Consolidation is just aggregation with a few tweaks.” For very simple groups with no intercompany trading and a single currency, the adjustments may be minimal. For groups with active intercompany trading, partial ownership, or multiple currencies, consolidation can produce results that differ materially from aggregation — as the worked example above shows.
“We use aggregated management accounts for the board — that’s good enough.” Boards making strategic decisions on acquisitions, financing, cost allocation, or entity performance need accurate group numbers. Aggregated accounts that include intercompany revenue overstate the group’s external earnings and distort entity-level profitability comparisons. The decisions made from that distorted picture are made with wrong information.
How BrizoConsol Supports Both
BrizoConsol allows finance teams to use the right approach for the right audience without maintaining two separate processes or data sets.
For fast internal reviews, an aggregated view across all entities is available immediately — pulling directly from connected accounting systems without waiting for eliminations to be posted. For full consolidation, intercompany eliminations, currency translation, NCI calculations, and accounting policy adjustments are applied in a structured workflow with full audit trail and drill-down to the underlying entries.
Where a group needs both — management accounts distributed before full consolidation is complete, and audited consolidated accounts at year-end — both run from the same underlying entity data. The difference between the two outputs is the adjustments applied, not a different data set or a rebuilt model. Finance teams review the same numbers at different stages of the close, with the elimination and adjustment layer made visible rather than hidden in a spreadsheet.
BrizoConsol is built for full group consolidation — intercompany eliminations, multi-currency translation, NCI, and accounting policy adjustments in one auditable workflow — with aggregated views available alongside for management reporting. Learn more or see it in action →